
Search
Dashboard
Purpose
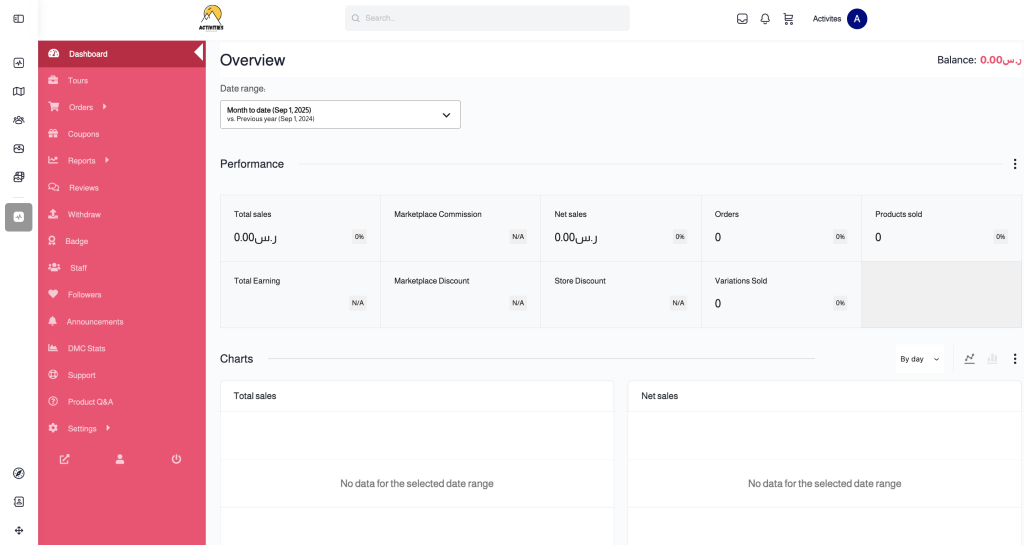
The Activities dashboard serves as your central command center for monitoring and managing your business operations. This comprehensive interface provides real-time insights into sales performance, financial metrics, and operational activities.
Key Features
Performance Metrics
- Track total sales, net sales, and orders in real-time
- Monitor marketplace commissions and discount applications
- View products sold and variation performance
- Access total earnings and financial summaries
Visual Analytics
- Interactive charts displaying sales trends over time
- Customizable date range selection (daily, monthly, yearly views)
- Comparative analysis with previous periods
- Clean data visualization with “No data” states for transparent reporting
Navigation & Management
- Quick access to Tours, Orders, Coupons, and Reports
- Staff and follower management tools
- Settings and support options
- Announcement and communication features
Interface Elements
- Left sidebar navigation with intuitive icons
- Balance display showing current account status
- Date range selector for flexible reporting periods
- Performance cards with key metrics and percentage changes
- Dual-chart layout for comprehensive sales analysis
Data Display
The dashboard uses a clean, professional layout with clear metric cards and responsive charts. All financial figures are displayed in the local currency, and percentage changes help track performance trends over selected time periods.